
Your finance team has a monthly reporting ritual that everyone dislikes. Data is exported from accounts software, sales figures arrive in separate spreadsheets, operations sends another workbook, and somebody spends days checking whether the totals match. By the time the board sees the finished report, the underlying picture may already have changed.
That is the problem Power BI reporting services should solve. The right platform can give decision-makers a consistent view of performance, while the wrong architecture can create licensing exposure, weak governance and a reporting estate nobody wants to maintain. For an East Midlands SME, the important question is not whether Power BI can produce attractive dashboards. It is whether the chosen environment, data model, security controls and support arrangement fit the organisation's operational reality.
Understanding the Core Power BI Reporting Environments
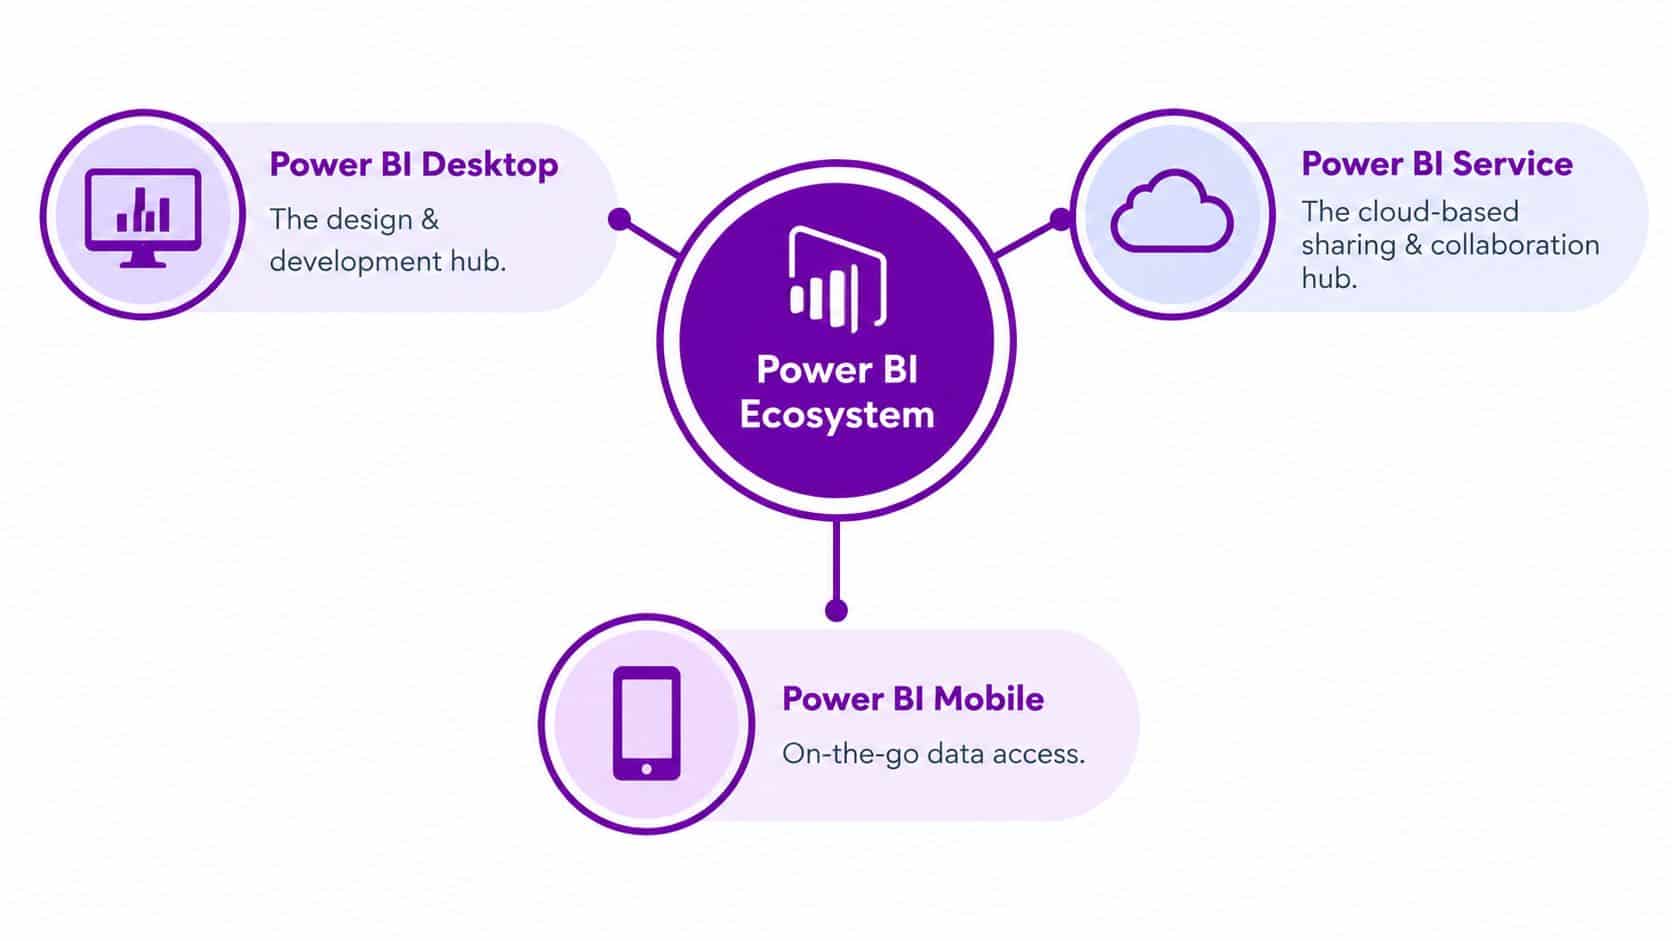
A growing UK business usually encounters three related environments: Power BI Desktop, Power BI Service and Power BI Report Server. Paginated reports sit across this ecosystem as a distinct reporting format, designed for documents that must print or render consistently rather than behave like an exploratory dashboard.
Power BI Desktop is the development workspace. Analysts connect to approved data sources, transform information, build relationships and create report pages. The Power BI Service is the cloud platform for publishing, sharing and collaborating around reports and dashboards. It supports a more collaborative operating model, where authorised users can access information through browsers and other Microsoft-connected experiences. Power BI Mobile extends access to smartphones and tablets for people who need performance information away from their desks.
Where Power BI Report Server fits
Power BI Report Server is the on-premises publishing environment. It gives an organisation a controlled location for reports where infrastructure, access and data-handling arrangements remain under its own administration, or within a chosen hosted environment. Microsoft documents that Report Server uses SQL Server to host its report server databases and supports local or remote SQL Server Database Engine instances in the installed architecture, as set out in the Power BI Report Server system requirements.
That distinction matters for organisations handling sensitive customer, employee, health, financial or public-sector information. It does not remove the need for access controls, auditing, patching or sound data governance, but it can make the infrastructure boundary easier to define.
Why paginated reports still matter
A dashboard is useful for investigating a trend. It is not always the right format for an invoice, statement, compliance return or operational document with strict page breaks. Paginated reports are built for highly formatted outputs, including tables that span pages, controlled headers and footers, and predictable print or PDF layouts.
The practical choice is therefore straightforward:
- Use Power BI Service when collaboration, self-service analysis and cloud delivery are the priority.
- Use Power BI Report Server when infrastructure control, data residency or isolation carries greater weight.
- Use paginated reports when the recipient needs a formal document rather than an interactive analysis tool.
A business can use more than one environment, but it should define ownership clearly. Without that decision, teams often publish similar reports in different places, creating conflicting figures and unclear responsibility for security.
Comparing Cloud Service and On-Premises Report Server
The cloud versus on-premises decision should begin with governance, not visual features. Power BI Service can reduce infrastructure administration and support rapid collaboration, but the organisation still needs to decide where data may be stored, who can share it and how identities, workspaces and retention are governed.
Power BI Report Server gives more direct control over the hosting boundary. It can be installed on-premises or in Azure virtual machines, but that does not make it maintenance-free. Microsoft's architecture places the report server databases on SQL Server, so performance and availability depend on SQL Server capacity, network latency and storage input/output as well as the report server tier. A slow or poorly sized database backend will undermine an otherwise well-designed reporting environment.
| Criteria | Power BI Service Cloud | Power BI Report Server On-Premises |
|---|---|---|
| Hosting model | Microsoft cloud service | Organisation-controlled infrastructure or Azure virtual machine |
| Data residency approach | Governed through tenant, region and data-handling policies | Governed through selected infrastructure and network controls |
| Infrastructure responsibility | Microsoft operates the service layer, while the customer governs configuration and access | Customer or hosting partner manages the report server and SQL Server backend |
| Collaboration | Strong fit for browser-based sharing and self-service analytics | Strong fit for controlled publishing and restricted access |
| Capacity planning | Focuses on tenant capacity, refresh and governance | Must cover both report server resources and SQL Server storage and processing |
| Best fit | Organisations prioritising cloud collaboration and service agility | Organisations prioritising control, isolation or specific residency requirements |
The licensing change boards must understand
Microsoft's 2025 to 2026 licensing position has made old online guidance unreliable. Microsoft says SQL Server 2025 consolidates on-premises reporting services under Power BI Report Server, and PBIRS becomes available for all paid editions of SQL Server. Older SQL Server versions still require Enterprise plus Software Assurance, according to Microsoft's Reporting Services consolidation FAQ.
That change could alter the economics for an SME with an existing SQL Server estate. It does not mean the cheapest route is automatically suitable. The board should ask which SQL Server version is in use, whether Software Assurance applies, whether the deployment requires a particular edition, and how the organisation will handle upgrades and support.
Board-level rule: Do not approve a Power BI migration until the licensing position, hosting boundary and SQL Server capacity plan have been documented together.
For regulated or data-sovereignty-sensitive operations, on-premises deployment may be the more defensible choice. For organisations with mature Microsoft cloud governance and a clear basis for cloud storage, Power BI Service may offer the simpler operating model. The decision should follow the data classification and support capability, not a preference for one dashboard interface.
Managed Power BI Services Versus In-House Teams
Buying licences does not create a reporting capability. Someone still has to connect data sources, design models, manage refreshes, review permissions, document definitions and support users when figures look wrong. The choice is whether those responsibilities sit with an internal team, a managed provider or a deliberate combination of both.
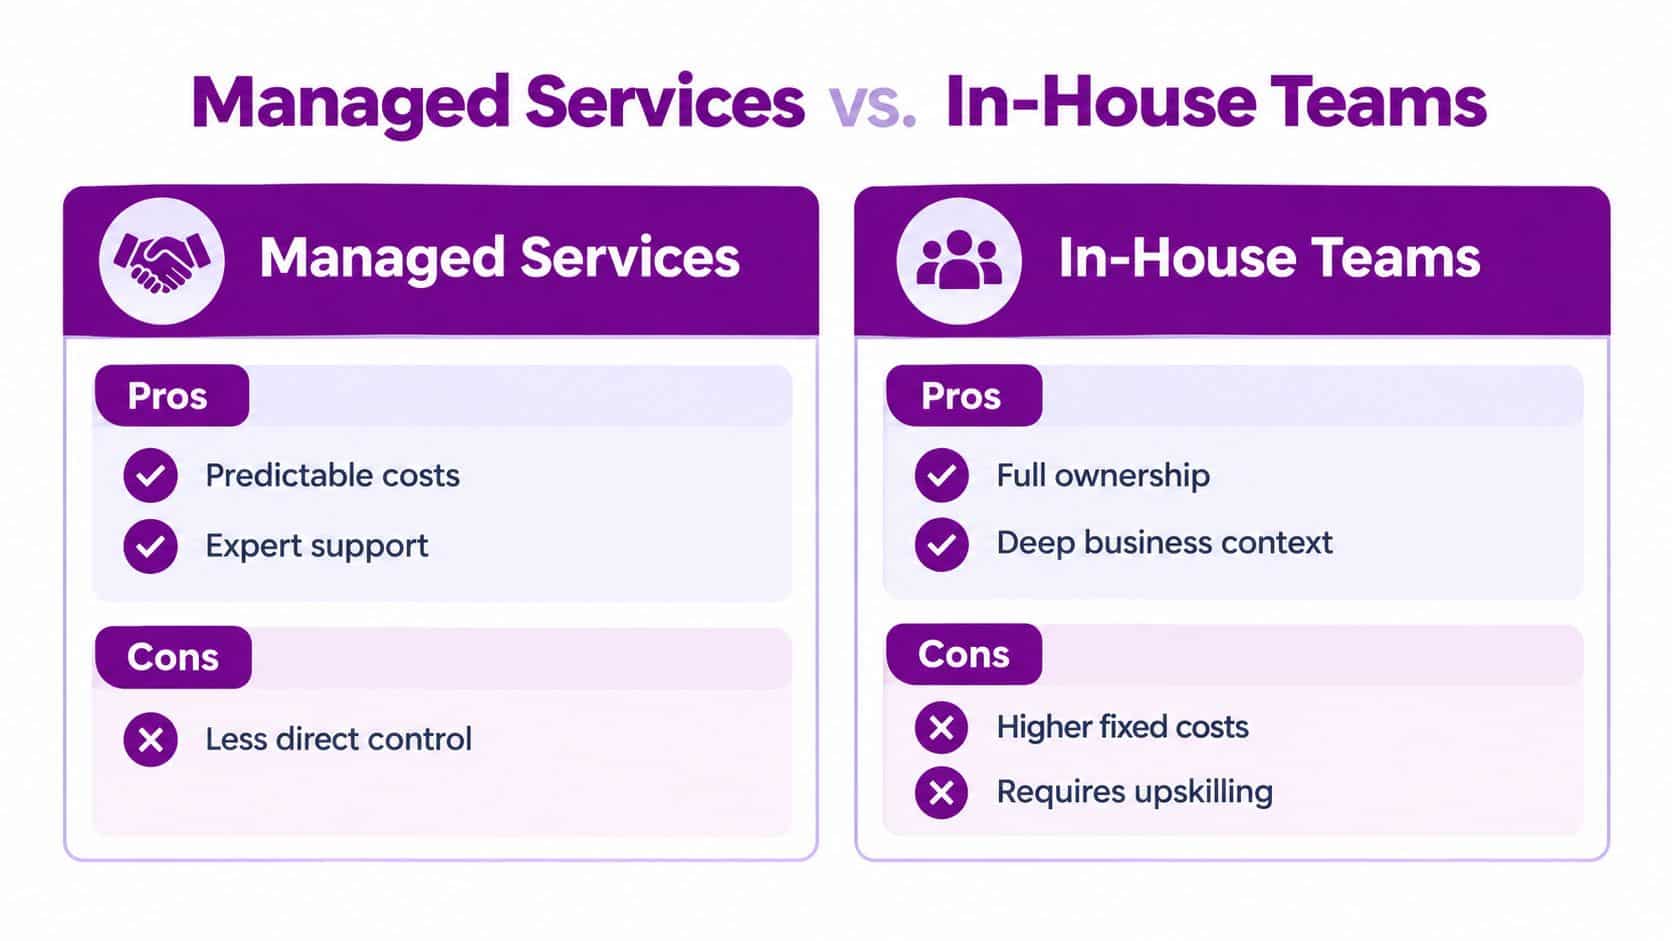
An in-house team has clear strengths. Internal analysts understand the organisation's terminology, processes and commercial priorities. They can work closely with finance, sales and operations, and they retain direct ownership of the reporting backlog. The weakness is concentration risk. If one person understands the data model, refresh process and security structure, that person becomes a dependency rather than a resource.
Recruitment also understates the cost of ownership. The organisation must fund employment overheads, management time, training, software administration and cover for holidays or departures. A small team may still lack the specialist knowledge needed for SQL Server performance, identity management, report design and information governance.
What a managed service should actually include
A managed Power BI reporting service should be more than a promise to build dashboards. A credible arrangement should define:
- Service ownership: Named responsibility for report incidents, refresh failures and access requests.
- Technical maintenance: Monitoring of data connections, gateway or server health, SQL Server dependencies and scheduled refreshes.
- Governance support: Agreed publishing rights, workspace structure, naming conventions and documentation.
- Change control: A process for adding metrics without changing the meaning of existing reports.
- Knowledge transfer: Clear runbooks and training so the customer is not trapped in an opaque supplier relationship.
F1Group is one option for East Midlands organisations seeking support with designing, publishing, deploying, securing and managing Power BI dashboards and reports. Its wider Microsoft-focused services can also be relevant where Power BI depends on Microsoft 365, Azure, Dynamics 365 or the Power Platform.
The sensible operating model
Most mid-sized organisations should avoid treating this as an ideological choice. Keep business ownership of definitions and priorities in-house, then use external specialists for architecture, implementation, security, performance and support where internal capacity is limited.
The commercial test is simple. Compare the cost of internal headcount and resilience with the recurring managed-service fee, then add the cost of delayed decisions, failed refreshes and poor adoption. If the internal team cannot provide dependable cover and governance, outsourcing is not surrendering control. It is assigning technical responsibility to a team that can be held to a defined service.
Typical Deliverables and Implementation Steps
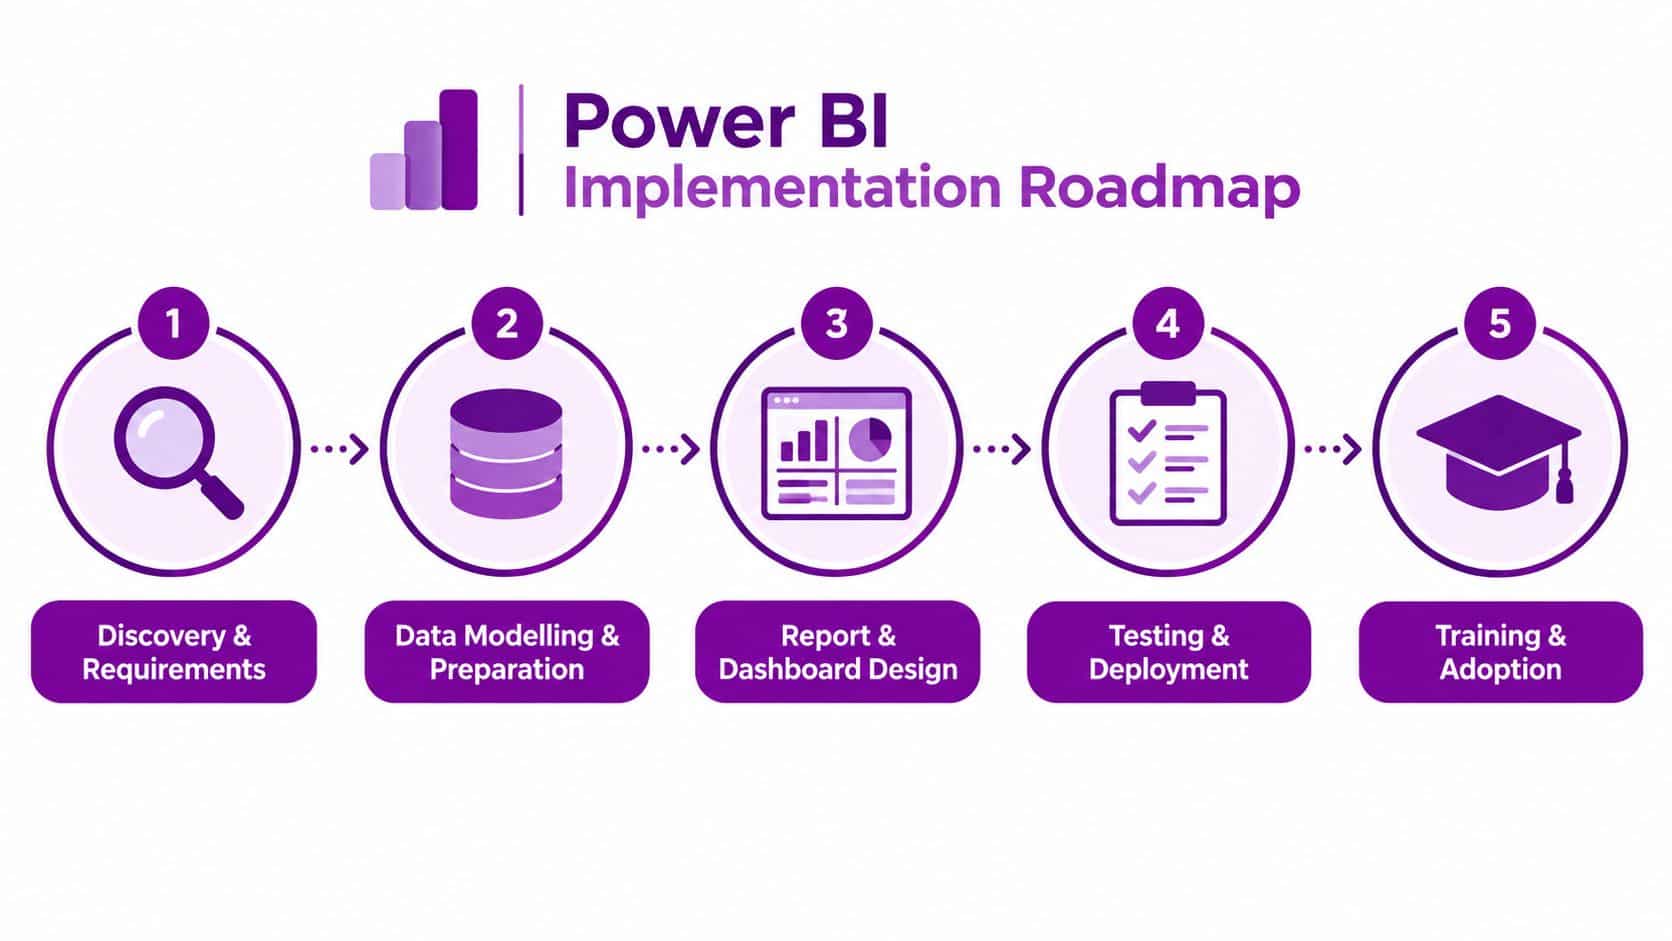
A professional deployment starts with the data estate, not the dashboard canvas. The first deliverable should be a documented view of systems, owners, data classifications, refresh expectations and existing reports. This prevents the team from building a polished presentation on an unreliable or duplicated source.
Start with discovery and connectivity
Ask department leaders which decisions they need to make, not which charts they want. Map source systems such as finance, CRM, stock control, production and spreadsheets. For Power BI Report Server, connectivity decisions need particular care. Microsoft confirms support for cached data, scheduled refresh and live or DirectQuery connections across a defined set of sources, including SQL Server, Azure SQL Database, Azure Synapse Analytics and Analysis Services, as documented in the Power BI Report Server data-source guidance.
The output should include a source catalogue, ownership matrix, data classification and connectivity risk log. Teams should also identify unsupported or unsuitable sources before development begins.
Build the model before the visuals
A reliable model gives the business a shared vocabulary. Define measures such as revenue, margin, orders, utilisation or service performance once, then document how each is calculated. Separate raw data preparation from the business model, and design relationships deliberately rather than allowing every report author to create their own interpretation.
The implementation should also establish:
- Role-based access: Users see the information appropriate to their responsibilities and data permissions.
- Refresh design: Each dataset has an agreed schedule, failure owner and escalation route.
- Report standards: Page layouts, colours, terminology and accessibility expectations remain consistent.
- Paginated outputs: Formal documents are designed separately where print, PDF or regulatory presentation matters.
Test the numbers and the controls
User acceptance testing should compare report results with approved source totals and real business scenarios. Test empty periods, amended transactions, late data, failed connections and users with different permissions. A report that looks correct for an administrator may expose too much information to a regional manager.
Deployment should include version control, a release record, support documentation and a rollback approach. Training then needs to focus on decisions, not button tours. Show managers how to interpret the report, explain data freshness and provide a route for challenging a metric.
Practical rule: Every published report needs an owner, a definition of its important measures and a named person responsible when the data stops refreshing.
Adoption is the final deliverable, not an optional workshop. Track which reports replace manual packs, which teams still export to spreadsheets and which questions remain unanswered. The provider should refine the environment around those findings.
Real-World Business Impact for East Midlands SMEs
The value of Power BI becomes visible when a business removes a specific decision bottleneck. Consider a manufacturer operating near Lincoln with stock held across several locations. Its management team may already have inventory data, purchase orders and production schedules, yet still rely on separate files to understand shortages, slow-moving stock and supplier commitments.
A governed report can bring those sources into a common operational view. The benefit is not the presence of a colourful chart. It is the ability to identify an exception, assign responsibility and act before the issue becomes a production delay or an urgent purchase.

Manufacturing decisions
A useful manufacturing report might combine production output, rejected units, stock availability, supplier status and order commitments. Supervisors need operational detail, while directors need a concise view of risk and capacity. The model should serve both audiences without forcing either group to reconcile competing spreadsheets.
The critical design choice is to distinguish a live operational view from a scheduled management report. If the underlying systems cannot support the required connection pattern, the business should set a clear refresh expectation rather than imply that information is current when it is not.
Retail and distribution
A Leicester-based retailer with several sites may struggle to compare sales, returns, labour costs and margin consistently. A shared model can standardise product, location and period definitions, helping managers investigate why turnover appears healthy while profit performance remains under pressure.
The report should expose the causes behind the headline figure. That may include discounting, product mix, returns, delivery costs or differences in how sites record transactions. A board pack that shows only total sales leaves the decision-makers to perform the difficult analysis manually.
Finance and service organisations
A professional-services or distribution business in Nottingham may have a different problem. Its leaders may spend too long assembling cash forecasts, debtor information, project performance and utilisation data from systems that were never designed to work together. Power BI reporting services can create a repeatable reporting process, provided the organisation first agrees which figures finance owns and how exceptions are investigated.
The outcome should be measured in business terms: fewer manual reconciliations, clearer accountability, earlier visibility of exceptions and more consistent management meetings. Avoid claiming an improvement before the baseline exists. Establish what the current reporting process consumes, where errors occur and which decisions are delayed, then assess whether the new service changes those conditions.
Securing Expert Support for Your Data Journey
The technical choice is only one part of the decision. An East Midlands SME also needs a support model that understands UK data governance, Microsoft licensing and the practical limits of its existing systems. A report server can provide a controlled hosting boundary, but the organisation remains responsible for access reviews, retention decisions, patching, backup, disaster recovery and the accuracy of the data it publishes.
Licensing requires the same discipline. Microsoft's current comparison identifies three routes for Power BI Report Server: Fabric F64 or higher reserved instances, SQL Server Enterprise Edition with Software Assurance, or SQL Server Enterprise subscriptions, as summarised in this UK Power BI licensing overview. The route that works for a large cloud estate may be unnecessary or uneconomic for an SME with established SQL Server infrastructure.
What to demand from a partner
Choose a partner that can work across the full reporting lifecycle, not just produce a demonstration dashboard. The engagement should cover:
- Assessment: Review the current data estate, report catalogue, licensing and governance risks.
- Architecture: Recommend Power BI Service, Report Server or a controlled combination based on actual requirements.
- Implementation: Build models, reports, paginated outputs, security roles and operational documentation.
- Support: Monitor failures, manage changes and help users resolve reporting issues.
- Capability transfer: Train internal owners and leave the organisation with understandable documentation.
F1Group provides managed IT services and Microsoft-focused support across the East Midlands, including Power BI, Microsoft 365, Azure, Dynamics 365, Power Platform and cyber security. That breadth is relevant when reporting depends on identity, cloud infrastructure, business applications or security controls rather than existing as an isolated dashboard project.
Do not begin with a request for a generic Power BI demonstration. Begin with your board reporting process, the sensitive data it contains, the systems that produce it and the decisions currently slowed by fragmented information. That conversation will reveal whether your immediate priority is a governed cloud workspace, an on-premises reporting platform, a licensing review or a complete reporting service.
F1Group can assess your data estate, clarify Power BI Service and Report Server trade-offs, and deliver secure managed Power BI reporting services for East Midlands organisations. Phone 0845 855 0000 today or Send us a message through F1Group to discuss your reporting environment and next steps.