
You've probably already got the raw material for better decisions. It's sitting in Excel files, your accounts package, Microsoft 365, your CRM, inboxes, and maybe a few reports someone exports every Friday. The problem isn't lack of data. The problem is that nothing lines up cleanly enough to answer the questions that matter.
Which customers are most profitable? Where are sales slowing? Which jobs overrun? Which service issues keep repeating? Most SME owners in the East Midlands don't get clear answers quickly. They get spreadsheets, opinions, and delays.
That's where business intelligence basics matter. Done properly, business intelligence isn't a big-company vanity project. It's a practical way to turn disconnected business information into something useful enough to run the company better.
From Data Overload to Decisive Action
If you're running a growing business, you already know the feeling. One system says sales are up. Finance says margin is tighter. Operations says stock is the issue. Customer service says complaints are rising in one area, but nobody can prove why.

That isn't a reporting problem. It's a decision problem. When data lives in silos, leaders fill the gaps with instinct. Instinct has its place, but it's a poor substitute for a clean view of what's happening.
Business intelligence fixes that by taking information from across the business and turning it into reports, dashboards, and visualisations people can understand. That matters far beyond the IT department. In the UK, data-driven companies already employ approximately 1.5 million people, and BI analysts earn an average salary of £40,809 according to Walbrook's business intelligence guide. Those figures tell you something important. Businesses are putting real value on people who can turn raw data into useful decisions.
What this means for an SME owner
You don't need a room full of analysts to benefit from BI. You need a way to answer commercial questions without waiting a week for someone to merge spreadsheets.
A good BI setup helps you:
- Spot trends earlier so you can act before a small issue becomes an expensive one
- See performance gaps clearly across sales, service, stock, projects, or finance
- Cut reporting friction so managers stop rebuilding the same numbers every month
- Make decisions on facts instead of whoever speaks most confidently in the meeting
Practical rule: If a management meeting spends more time arguing about whose numbers are right than what to do next, you need business intelligence.
For most SMEs, the win isn't fancy analytics. It's clarity. When the same trusted data reaches directors, managers, and frontline teams in a format they can use, decisions get faster and better. That's the essential starting point.
Demystifying Business Intelligence and Analytics
People often lump business intelligence and business analytics together. That creates confusion and bad buying decisions. If you don't know the difference, you'll either buy too much, too soon, or expect the wrong outcome from the tools you already have.
Business intelligence looks at historical business data to clarify existing information. Business analytics looks forward and tries to predict future events. Adobe's UK overview puts it plainly in its explanation of business intelligence definition. BI is a subset of business analytics, and it focuses on descriptive analytics to show what happened and why.
A simple way to think about it
BI is your dashboard and rear-view mirror.
It tells you your current speed, fuel level, engine temperature, and what's already happened on the road behind you. That's what most SMEs need first. Before you try to predict next quarter, you need a reliable picture of this quarter.
Business analytics is more like satellite navigation. It helps estimate what's likely to happen next and suggests the best route ahead.
That distinction matters because many businesses skip the foundation. They start talking about AI predictions before they've even agreed on basic sales figures, margin reporting, or service KPIs. That's backwards.
The questions BI should answer first
A sensible BI setup should answer questions like these:
-
What happened last month
Revenue, margin, stock movement, support volume, debtor days, or project performance -
Where did it happen
By customer, region, branch, product line, account manager, or team -
Why did it happen
Was there a pricing issue, a process bottleneck, a missed target, or a shift in customer behaviour -
What needs attention now
Not in six months. Now.
Good BI doesn't predict the future by magic. It removes confusion from the present.
That's also why non-technical owners and managers tend to get value from BI quickly. They don't need to become data specialists. They need clean reporting that answers operational questions in plain English.
If you want a separate example of how AI is being applied to a specialist reporting problem, Alignmint's AI donor analytics is a useful read. It shows how data tools become more valuable when they help non-technical teams ask better questions, not just build more reports.
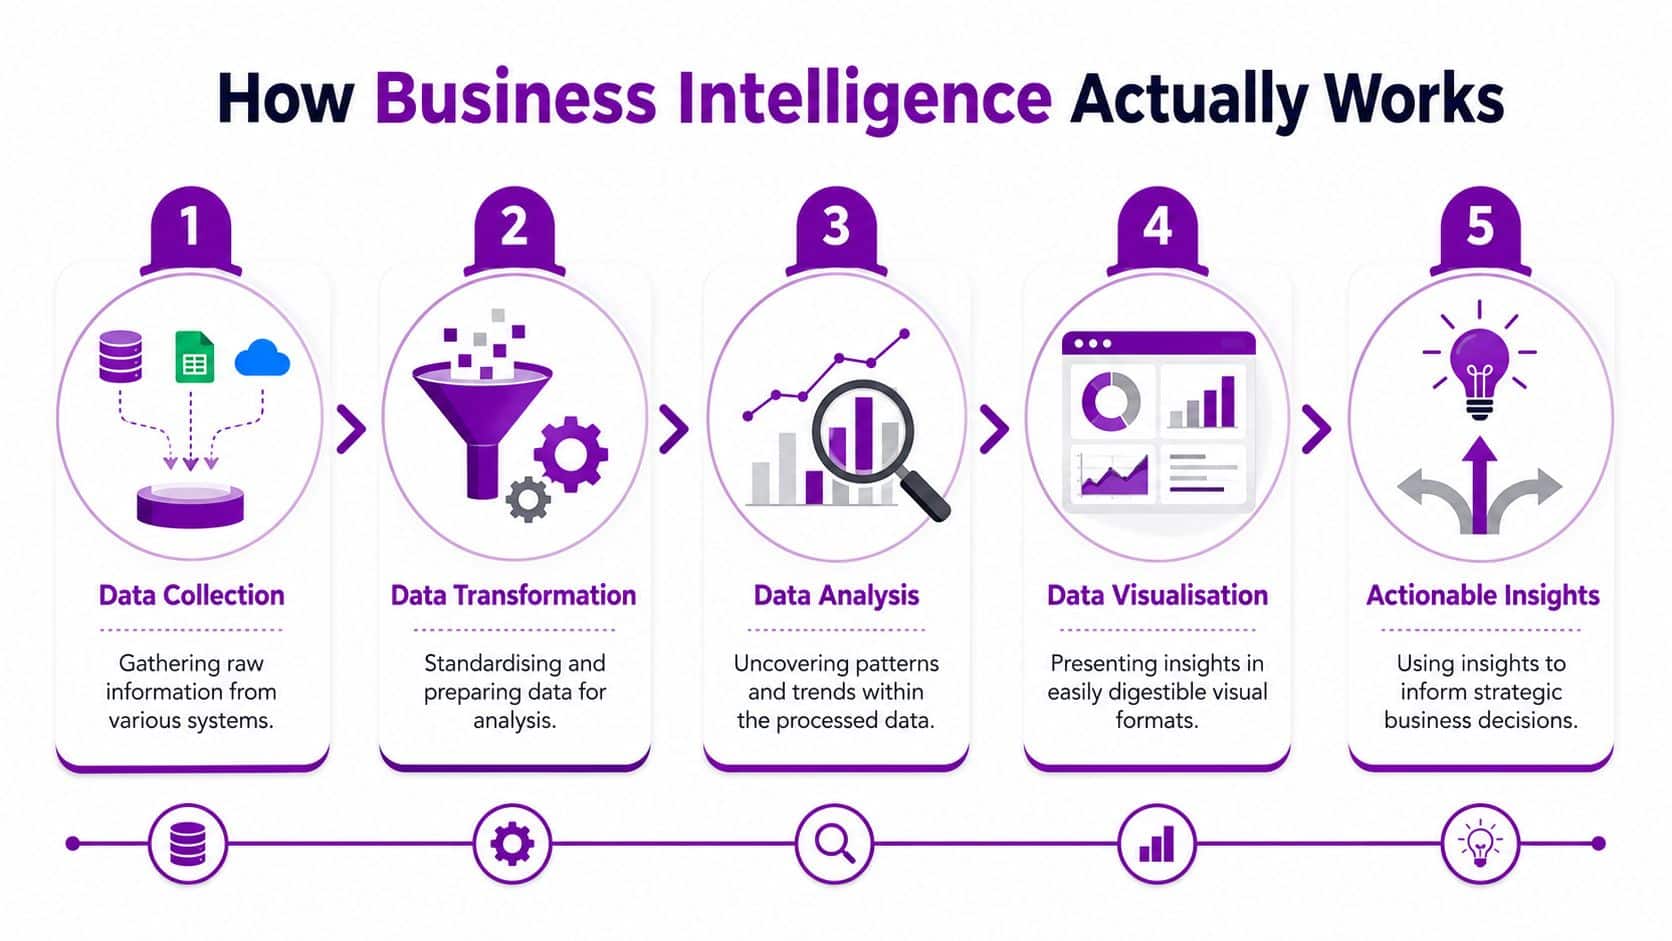
How Business Intelligence Actually Works
Business intelligence isn't a black box. It's a sequence. If one part is weak, the final dashboard will look polished but tell you the wrong story.
Modern BI is commonly described through five core processes: data preparation, data mining infrastructure, statistical analysis, data visualisation, and visual analysis, as outlined in Tableau's explanation of modern business intelligence.
Data preparation
The handling of data often determines the success or collapse of most BI projects. You gather data from the systems you already use, then clean it so it means the same thing everywhere.
If one report says “Nottingham”, another says “Nottm”, and a third leaves the field blank, your regional reporting is already compromised. The same goes for customer names, product codes, dates, departments, and invoice statuses.
For an SME, this usually means pulling data from sources such as:
- Microsoft Excel files maintained by different teams
- Dynamics 365 records for sales and service
- Accounts software for revenue, cost, and debtor visibility
- Microsoft 365 data that shows activity, collaboration, or task flow
Data mining infrastructure
Once data is prepared, it needs somewhere stable to live and a structure that supports reporting. This doesn't need to be exotic. It needs to be dependable.
The infrastructure layer stores and organises data so reports don't depend on one person emailing a spreadsheet every Monday. If you're looking at a cloud-first setup, this guide to cloud for business intelligence is worth reviewing because it frames the infrastructure question in practical business terms.
Statistical analysis and visualisation
Patterns begin to emerge. Statistical analysis in BI is about uncovering what changed and why. That can include trend analysis, basic comparisons, or testing whether one pattern is different from another. T-Gency's article on statistical analysis in business intelligence gives a useful practical grounding here.
Then comes visualisation. Numbers become charts, trend lines, heat maps, and KPI summaries that people can read in seconds rather than minutes.
Visual analysis
This is the part many owners care about most, even if they don't call it that. Visual analysis means using dashboards to tell the story behind performance.
A sales chart on its own is just a chart. A dashboard that shows falling revenue in one region, linked to lower conversion and longer response times, gives a manager something to act on.
For marketers in particular, a broader marketing data analytics guide can help connect this thinking to campaign reporting and lead quality.
Key judgement: If your dashboard looks impressive but nobody changes behaviour after seeing it, the BI process hasn't finished.
Your BI Toolkit in the Microsoft Ecosystem
If your business already uses Microsoft 365, Excel, Teams, Dynamics 365, or Azure, you've got a head start. You don't need to bolt together a random stack of disconnected products. The Microsoft ecosystem already covers the main BI requirements for most SMEs.
That's why I usually recommend a Microsoft-first approach for East Midlands businesses. It's practical, familiar, and easier to support. It also reduces the usual mess of duplicated logins, awkward integrations, and reporting held together with manual exports.
Where each Microsoft tool fits
Power BI is the obvious centrepiece. It turns data into dashboards, reports, and interactive visual views that managers can use without trawling through rows of raw figures.
Excel still matters. Many SMEs begin there, and that's fine. Excel often acts as the first usable source of structured data before reporting matures.
Dynamics 365 provides rich operational data. Sales pipelines, customer service cases, activities, opportunities, and account history all become more useful when surfaced through BI rather than left buried in forms and records.
Azure handles the heavier lifting when you need central storage, data movement, or a more scalable reporting foundation.
The Microsoft BI Stack for SMEs
| Tool | Primary Role in BI | Example Use |
|---|---|---|
| Power BI | Reporting and visualisation | Build a director dashboard showing sales, margin, and open service issues |
| Excel | Starting data source and ad hoc analysis | Import monthly sales files and standardise them for reporting |
| Dynamics 365 Sales | Customer and pipeline data | Track lead sources, conversion stages, and salesperson performance |
| Dynamics 365 Customer Service | Service and support visibility | Report on ticket themes, backlog, and resolution patterns |
| Azure SQL Database | Centralised data storage | Hold cleaned reporting data from multiple systems in one place |
| Azure Data Factory | Data movement and preparation | Pull information from line-of-business systems into a reporting model |
| Microsoft Teams | Distribution and collaboration | Share dashboards with managers inside the platform they already use |
| Copilot for Microsoft tools | Natural-language interaction | Let non-technical users ask questions about dashboard data |
For owners and managers who want a more hands-on starting point, this Power BI tutorial for beginners is a sensible place to begin.
Why this stack works for SMEs
It isn't just about features. It's about reducing friction.
- Familiar tools mean staff are less intimidated
- Shared security and identity simplify access control
- Cleaner integration reduces manual reporting work
- Scalability lets you start small and grow without replacing everything later
The biggest mistake is assuming BI must begin with a huge platform project. For most SMEs, the best route is to use the Microsoft tools already close at hand, then tighten the process around them.
Practical BI Use Cases for Growing Businesses
The value of BI becomes obvious when you stop talking about platforms and start looking at day-to-day decisions. Most owners don't want “advanced analytics”. They want fewer blind spots.

Sales visibility that changes weekly decisions
A sales director often has pipeline figures in one place, invoiced revenue in another, and account activity scattered across inboxes and CRM notes. That setup hides problems until month-end.
With a Power BI dashboard, the director can compare sales by region, product line, and salesperson in one view. If one area is generating plenty of quotes but weak conversion, the issue becomes visible quickly. That allows for immediate intervention, whether that's pricing review, better follow-up, or coaching.
The point isn't the chart. The point is catching drift before it becomes a missed quarter.
Marketing that proves what's working
Marketing teams in SMEs regularly report activity instead of results. Clicks, email opens, social engagement. Useful, but incomplete.
The better approach is to connect campaign data with CRM outcomes so managers can see which leads turned into actual opportunities or customers. That changes the conversation from “Which campaign was busy?” to “Which campaign generated business?”
If retention is part of your growth plan, the logic is similar. This article on reducing churn in SaaS is a useful parallel because it shows how performance signals become more useful when tied to customer outcomes rather than vanity metrics.
Here's a short explainer that shows how BI supports clearer business reporting in practice:
Operations and service bottlenecks
Operations managers usually know there's a bottleneck before they can prove it. Orders seem slow. Tickets feel stuck. Delivery dates keep slipping. But feelings don't help you prioritise.
A practical BI dashboard can show work in progress, overdue tasks, repeat faults, service backlog, or recurring causes of delay. Once that's visible, managers can act on root causes instead of firefighting symptoms.
When one dashboard lets sales, finance, and operations look at the same issue through the same numbers, blame drops and action improves.
That's why business intelligence basics matter so much for growing firms. The first payoff is often operational discipline, not technical sophistication.
An SME Roadmap to Implementing BI
Most SMEs delay BI because they think the starting line is expensive, technical, and disruptive. It doesn't have to be. The main barrier is usually uncertainty. Owners aren't sure where to begin, what to prioritise, or how to justify the spend without a data team.
That's exactly where modern tools help. A key gap for UK SMEs is justifying BI without specialist staff, and tools with natural-language interfaces, such as Copilot for Power BI, can help non-technical users work with data without traditional coding skills, as highlighted in Domo's discussion of business intelligence components.
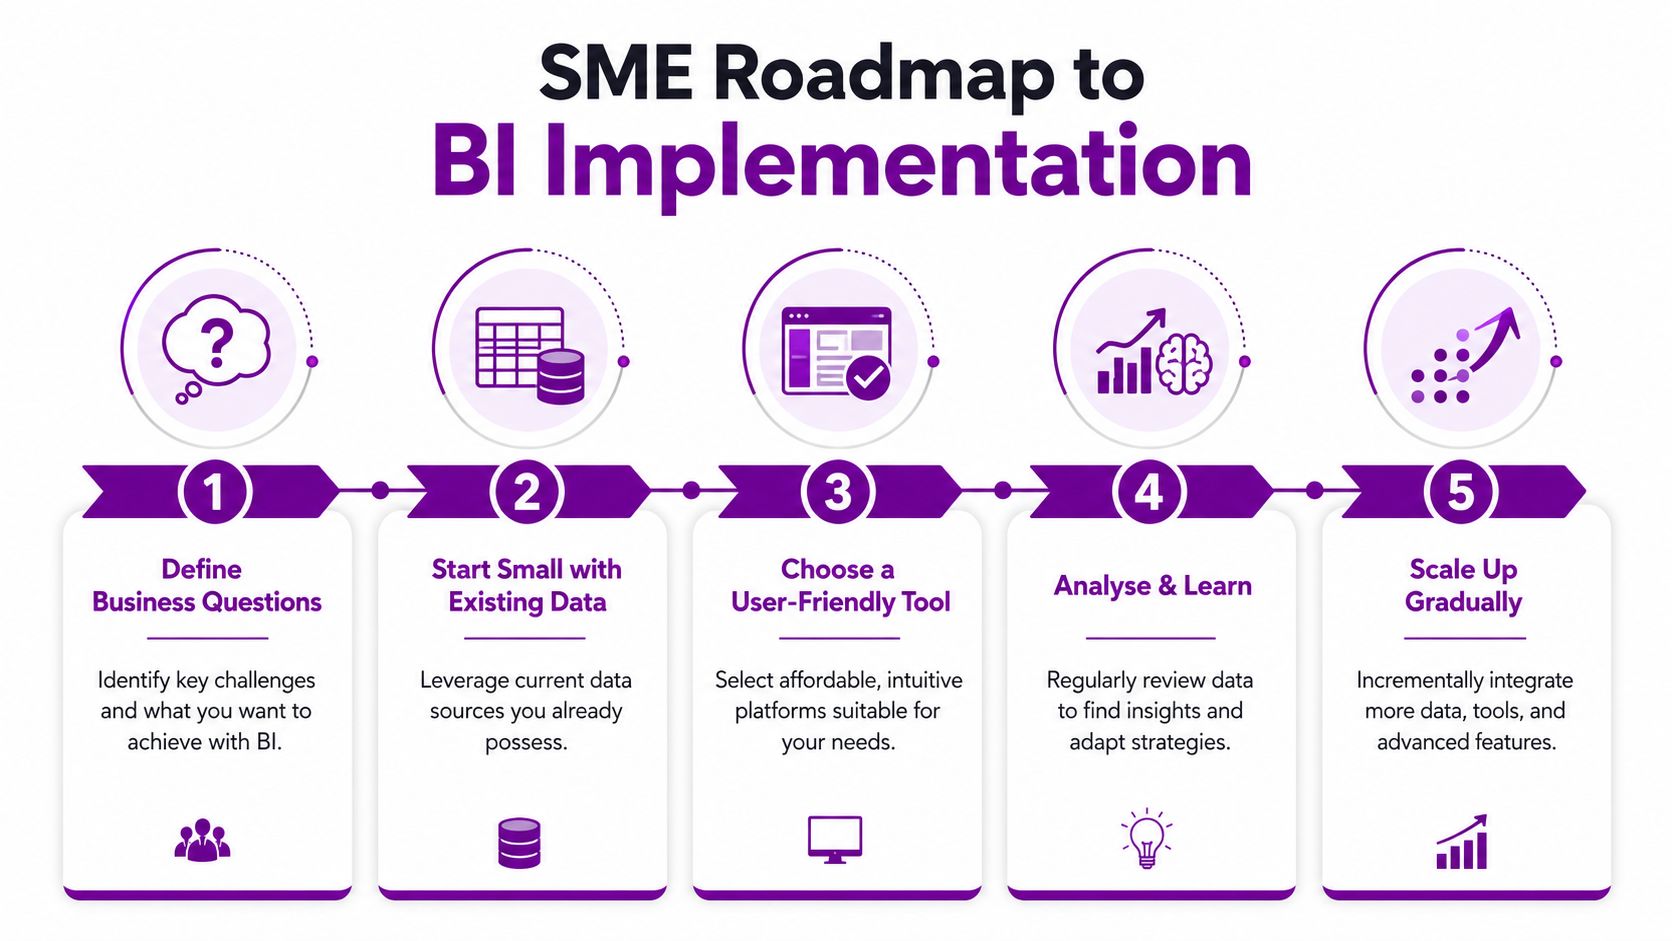
Phase one start with one business question
Don't begin with software. Begin with a question that matters commercially.
Examples:
- Which customers generate strong revenue but weak margin
- Why are some quotes not converting
- Where are service tickets getting stuck
- Which product lines create the most rework
Use existing data first. Excel is acceptable at this stage if the question is clear and the data is workable. The aim is to prove usefulness quickly, not build a perfect architecture on day one.
Phase two connect your core systems
Once the first reporting need is proven, connect the systems that matter most. Usually that means finance, CRM, service, and operational data.
Many businesses should standardize around Microsoft. Pulling together Dynamics 365, Microsoft 365 data, and finance information into Power BI gives you a much more reliable management view than separate exports ever will. If you need support shaping that journey, a business intelligence consultant can help prevent the usual false starts.
Phase three put simple governance in place
Bad BI usually comes from bad discipline, not bad software. You need some light governance early.
Use a checklist like this:
- Data owner who is responsible for each key dataset
- Definition control so terms such as revenue, active customer, or overdue mean one thing
- Accuracy checks to confirm source data is trustworthy
- Access rules so sensitive information is seen by the right people
- Refresh routine so everyone knows when the numbers update
Phase four widen access with Copilot and self-service
BI provides greater value to the wider business. Managers who would never build a report can still ask plain-language questions and explore results without relying on IT for every small change.
That matters for SMEs because it lowers the adoption barrier. If only one technically confident person can interpret the data, you haven't really embedded BI.
The best SME BI rollout is boring in the right way. Clear question, trusted data, useful dashboard, repeat.
Phase five scale carefully
Once a few dashboards are actively used, scale by need, not enthusiasm. Add more data sources, automate more preparation, and refine access rules. Don't flood the business with reports nobody asked for.
The smartest roadmap is gradual, disciplined, and tied to business outcomes.
Common Pitfalls and Your Next Steps
Three mistakes derail most BI efforts.
Dirty data and fuzzy definitions
If customer names, dates, product codes, or statuses are inconsistent, your dashboard won't rescue you. It will display bad information more attractively. Fixing source quality is never glamorous, but it's essential.
No business question
A dashboard without a decision attached to it is decoration. If nobody knows what action the report is supposed to support, adoption fades quickly.
Tool-first thinking
Some businesses buy a platform and assume value will appear. It won't. The tool matters, but the reporting model, ownership, and user behaviour matter more.
A better approach is simple. Start with one important question. Use data you already have. Build something managers will use. Then improve the model, governance, and delivery as the organisation grows.
Business intelligence isn't just for enterprises with large data teams. It's accessible, practical, and increasingly well suited to SMEs that already rely on Microsoft technology. If you want cleaner reporting, faster decisions, and fewer arguments about whose spreadsheet is correct, BI is no longer optional. It's operational common sense.
If you want expert help turning Microsoft 365, Dynamics 365, Azure, and Power BI into a practical reporting setup for your business, speak to F1Group. We help organisations across the East Midlands build dependable, useful BI that non-technical teams can use. Phone 0845 855 0000 today or Send us a message.