
Most mid-sized firms don’t have a data problem. They have a visibility problem.
Sales figures sit in Dynamics 365, finance works from exported spreadsheets, operations tracks activity in another system, and someone in management still waits for a monthly pack that’s already out of date by the time it lands. In Lincoln, Nottingham, Leicester, and the wider East Midlands, that pattern is common. The business is generating useful data every day, but it isn’t organised in a way that helps people act quickly.
Cloud for business intelligence fixes that when it’s done properly. In practical terms, it means bringing data from across the business into a secure cloud platform, shaping it so it’s consistent, and presenting it through live dashboards and reports in tools such as Microsoft Power BI. That’s not just a reporting upgrade. It changes how managers spot issues, how teams measure performance, and how leaders decide where to invest time and budget.
The hard part isn’t buying licences. It’s designing a setup that people will trust and use. That means choosing the right Microsoft services, keeping governance tight, and avoiding the common mistake of moving bad reporting habits into a newer platform. If you’re also reviewing how to reduce operational data risk, governance needs to be part of the BI discussion from day one, not something bolted on after the first dashboard goes live.
From Data Overload to Decisive Action
A typical SME has more systems than it realises. Microsoft 365, a finance package, a CRM, a warehouse system, payroll, and a scattering of Excel workbooks built by different departments over several years. Each one answers part of the story. None of them gives the full picture on its own.
That creates predictable friction. Teams argue over whose numbers are right. Reports have to be rebuilt manually. Senior staff spend time reconciling data instead of deciding what to do with it. The result isn’t just delay. It’s hesitation.
What Cloud BI actually means
Cloud for business intelligence isn’t a vague transformation term. It’s a working model built around a few clear outcomes:
- One version of reporting data so finance, sales, service, and operations stop using different definitions.
- Live or near-live dashboards instead of static packs sent as attachments.
- Access from anywhere through secure Microsoft identity controls.
- A platform that can grow without buying and maintaining more on-premises infrastructure.
For East Midlands SMEs, the appeal is usually practical rather than flashy. A managing director wants a daily margin view. An operations lead wants to see delayed orders before customers complain. A finance team wants less month-end spreadsheet surgery. Those are business problems first, technical problems second.
Good BI doesn’t impress people because the charts look modern. It earns trust because the numbers reconcile.
The shift that matters
The biggest change is cultural. Once data is centralised and visible, meetings become shorter and more useful. People stop debating the spreadsheet extract and start discussing the action.
That’s where the Microsoft stack tends to work well for UK SMEs. If you’re already using Microsoft 365, Dynamics 365, Teams, SharePoint, and Azure, cloud BI can sit inside tools your staff already know. Adoption is usually stronger when people don’t feel they’re learning an entirely separate ecosystem.
Why Cloud BI is a Game Changer for SMEs

For a mid-sized business in Nottingham, Lincoln, or Leicester, the issue is rarely a lack of data. The issue is delay between an event and a decision. Orders slip, margins tighten, service demand spikes, and the management team sees it too late because reporting still depends on exports, manual checks, and someone joining figures together in Excel.
Cloud BI changes that operating model. It gives SMEs access to reporting, modelling, and dashboarding that used to need more infrastructure, more specialist resource, and more time than many businesses could justify. With Microsoft Azure and Power BI, the entry point is far more realistic for firms that need better control without taking on enterprise-scale complexity.
Better decisions with less friction
The commercial value is straightforward. Faster reporting reduces avoidable mistakes.
If stock data is a day behind, sales teams commit to dates the warehouse cannot meet. If finance reviews last week’s numbers, cash flow decisions are based on the wrong picture. If directors only see monthly packs, they tend to spot issues once they have already affected margin or customer service.
A properly designed cloud BI setup shortens that gap. Teams work from shared definitions, refresh data more frequently, and investigate exceptions while there is still time to act. In practice, that matters more than having flashy dashboards.
Microsoft’s platform also brings useful AI features into day-to-day reporting. Power BI can surface trends, anomalies, and plain-English summaries that help non-technical users get to the point faster. For an SME, that usually means less time spent asking for another version of a report and more time deciding what to do next.
Why non-technical teams often see the quickest return
The first gains usually show up outside IT.
Finance managers get a cleaner view of actuals versus forecast. Sales leaders can check pipeline quality without waiting for a fresh CRM extract. Operations teams can track fulfilment, delays, and returns in one place. Directors can review the same figures as departmental managers instead of sitting through meetings about whose spreadsheet is correct.
That can look like:
- Sales managers checking pipeline health in Power BI without requesting a fresh CRM export.
- Finance teams comparing actuals to forecast through a consistent model rather than multiple workbooks.
- Service leads spotting recurring issues by account, location, or product line.
- Directors using Microsoft AI features to explore trends and identify follow-up questions faster.
A short explainer is useful here:
The competitive advantage for East Midlands SMEs
Smaller firms do not need a large analytics department to run with more discipline. They need reliable reporting that people trust and use every week.
That is where cloud BI earns its keep. Instead of relying on one person who understands the spreadsheet logic, the business works from governed data models, repeatable reports, and controlled access through Microsoft 365 and Azure. That reduces key-person risk, improves consistency, and makes reporting easier to scale as the business adds sites, product lines, or new systems.
For East Midlands SMEs, that matters because growth is often uneven. A manufacturer in Lincoln may add a new customer and suddenly need better production and margin visibility. A professional services firm in Nottingham may need clearer utilisation and pipeline reporting before hiring. A distributor serving the wider region may want branch-level performance without maintaining more on-premises infrastructure.
The point is practical. Cloud BI helps smaller businesses make better decisions earlier, using tools that fit the Microsoft estate many of them already have.
When the right users can answer routine questions themselves, IT spends less time producing reports and more time improving the data behind them.
Understanding a Microsoft Cloud BI Architecture
A sensible Microsoft BI architecture starts with a simple question. Where does the business need trusted numbers first?
For an East Midlands SME, that usually means pulling data out of finance, operations, CRM, and spreadsheets, then turning it into a model people can use without arguing over whose version is right. The technical stack matters, but the order matters more. In practice, the best design is the one that gives a firm in Lincoln or Nottingham reliable reporting quickly, without loading it with Azure services it will not use for another 18 months.
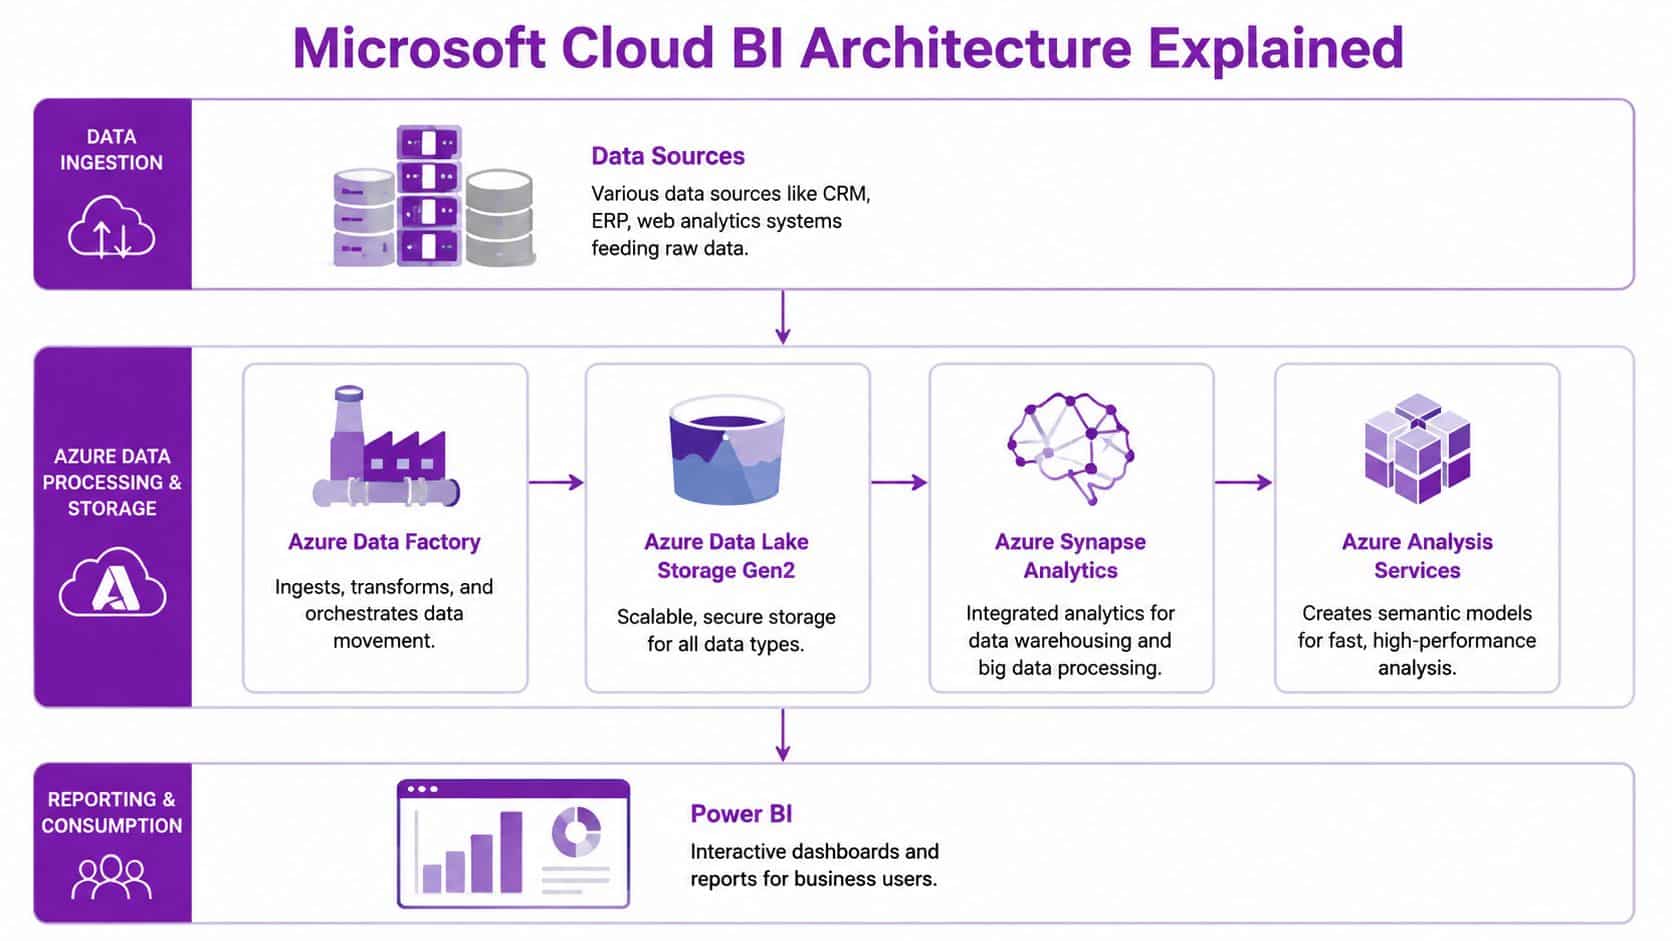
The core Microsoft building blocks
Most Microsoft cloud BI solutions are built from the same set of parts, with different levels of depth depending on scale and budget:
- Data sources such as Dynamics 365, Sage, SQL Server, Excel files, payroll systems, warehouse systems, and other line-of-business applications.
- Azure Data Factory to schedule and orchestrate data movement between those systems.
- Azure Data Lake Storage Gen2 to store raw extracts and prepared data cost-effectively.
- Azure Synapse Analytics where larger businesses need more processing power, SQL-based transformation, or a central analytics workspace.
- Semantic modelling in Power BI, or in some cases Azure Analysis Services, to define measures, relationships, hierarchies, and shared business logic.
- Power BI for reports, dashboards, security trimming, subscriptions, and self-service analysis.
A mid-sized business does not always need the full stack from the start. We often recommend a lighter first phase: connect a defined set of source systems, build a clean data model in Power BI, prove adoption, then add Data Lake or Synapse when refresh windows, source complexity, or data volumes justify it. That approach keeps cost under control and avoids building an enterprise platform for a reporting requirement that is still quite modest.
ETL and ELT in plain English
One architecture choice affects cost, maintainability, and performance early on. Do you reshape the data before it lands in Azure, or after it lands?
ETL means extract, transform, load. The data is cleaned before it reaches the target platform. ELT means extract, load, transform. Raw data lands first, then Azure or Power BI handles more of the processing.
For many SMEs, ELT is the better fit because it is easier to audit, easier to change, and less dependent on old scripted jobs running on local servers. If a manufacturer in Lincoln adds a new production system, or a distributor in Nottingham changes its order platform, the team can ingest the raw data first and adjust the transformation logic without rebuilding the whole pipeline.
That does not mean ETL is wrong. ETL still makes sense where source systems are messy, where sensitive data should be filtered before landing in the platform, or where limited connectivity makes cloud-side transformation awkward. The right answer depends on the systems you already have and who will support them.
What works and what causes problems
The firms that get value from cloud BI usually keep the architecture boring in the right places. They are disciplined about source systems, KPI definitions, and access control.
| Area | What works | What causes trouble |
|---|---|---|
| Data ingestion | Start with a defined set of trusted systems | Connecting everything at once |
| Modelling | Agree core business definitions early | Letting each department define its own KPIs |
| Security | Use role-based access through Microsoft identity | Sharing broad access for convenience |
| Performance | Design for refresh patterns and report usage | Building complex visuals on poor-quality models |
The reporting layer is only one part of the solution. Power BI sits on top of the model, storage, transformation logic, and governance decisions underneath it. If those foundations are weak, the dashboards will look polished but still create confusion. If you want a clearer picture of what Power BI is used for in day-to-day business reporting, start there. Then design the Azure components around the decisions your business needs to make.
Real-World Cloud BI Use Cases for Your Business
On Monday morning, the leadership team wants answers. Why did margin drop on a product line in Lincoln, which customers are costing more to serve from Nottingham, and why has service demand shifted in Leicester? Cloud BI earns its keep when those questions can be answered from one model in Power BI, using current data rather than a patchwork of spreadsheets.

Manufacturing in Lincoln
A mid-sized manufacturer usually has ERP data, shop-floor records, quality checks, and sales information split across different systems. The reporting problem is rarely a lack of data. It is the delay between an issue appearing on the line and someone seeing the pattern clearly enough to act.
With Azure and Power BI, those sources can be brought together into a daily or near real-time operational view. Production managers can track scrap, downtime, output against plan, late orders, and margin by product family in one place. Finance gets a clearer picture of true profitability. Operations gets earlier warning that a line, shift, or product mix is causing trouble.
Useful manufacturing dashboards answer questions such as:
- Which lines are driving the highest waste and rework cost?
- Where is throughput slipping against the production plan?
- Which products look profitable until returns, scrap, or overtime are included?
- Where is customer demand outpacing available capacity?
For East Midlands firms, that usually starts with one plant, one reporting pack, and a handful of agreed KPIs. Trying to model every machine and every historical measure on day one is how projects stall.
Logistics in Nottingham
Logistics teams need to see service performance and commercial performance together. A depot can look busy and still lose money on poor route planning, failed deliveries, or customers with awkward fulfilment patterns.
A sensible cloud BI model combines order volumes, dispatch times, route performance, service exceptions, fuel or subcontractor cost, and account revenue. That lets planners and managers compare depots, spot recurring delays, and identify accounts that erode margin. It also helps commercial teams stop pricing work on assumptions that no longer hold.
If you are assessing the reporting layer itself, this guide on what Power BI is used for in day-to-day business reporting shows where it fits.
The best logistics dashboards stay focused. They show the indicators that support intervention during the day, not fifty charts that nobody acts on.
Some firms also add forecasting or optimisation work alongside BI. Where that involves custom integrations, route modelling, or Python-based processing, it can make sense to hire python developers for the specialist components while keeping the core reporting stack in Microsoft.
Charities and public-interest organisations in Leicester
Charities and public-interest organisations often have the same reporting problem as commercial firms. Fundraising, service delivery, volunteer activity, finance, and compliance records sit in separate applications, with manual collation at month end.
Cloud BI helps by joining those datasets into a reporting model trustees and senior managers can use. A charity can track campaign response, donation trends, case volumes, referral sources, restricted funding, and service outcomes without waiting for someone to rebuild the same spreadsheet pack every month. Copilot features may help with analysis and summarisation, but they need proper security, careful testing, and realistic expectations about output quality.
That trade-off matters. For many East Midlands organisations, the first win is not AI. It is getting one trusted view of performance, with role-based access and clear audit trails, so management meetings spend less time debating whose numbers are right.
Your Phased Roadmap to Cloud BI Implementation
A finance director in Nottingham often starts in the same place. Month-end takes too long, sales and operations disagree on the numbers, and every request for a new report turns into another spreadsheet. A phased rollout fixes that by putting the first effort into decisions, ownership, and data quality rather than trying to build everything at once.

Phase 1 and Phase 2
Start with discovery and planning. Pick a small number of business questions that affect profit, cash, or service levels. For an East Midlands manufacturer, that might be gross margin by product line. For a distributor in Lincoln, it may be stock turns and delayed orders. For a service business in Nottingham, it is often utilisation, SLA performance, and debtor days.
Then build the data foundation properly. Connect the first systems, decide who owns each data set, and agree what key metrics mean before anyone designs dashboards in Power BI. That avoids a common problem in SME projects, where teams move too quickly into visualisations and only later realise finance, operations, and sales are calculating the same figure in three different ways.
Skills gaps are common, especially where the internal IT team is already busy with ERP support, Microsoft 365, cyber security, and day-to-day issues. Plan for that early. If the business needs a wider migration path as well as BI delivery, it helps to follow an Azure cloud adoption framework for structured rollout.
Phase 3 and Phase 4
Build the first release around one or two use cases with visible commercial value. In practice, that usually means a management dashboard, an operational exceptions view, and a simple drill-through path for investigation. Keep the scope tight enough that users can test it properly and the project team can correct data issues quickly.
After that, focus on adoption. Good training is less about clicking buttons and more about trust. Users need to know where the data comes from, how often it refreshes, who owns each metric, and what to do when something looks wrong. I have seen technically sound Power BI projects stall because staff were given access but not enough context to use the reports confidently.
Some firms also need work outside the standard Microsoft stack. API integrations, custom data transformation, and workflow automation sometimes sit better in a small specialist build alongside Azure and Power BI. In those cases, options such as hire python developers can support bespoke parts of the solution without changing the core BI approach.
Phase 5
Optimisation turns a first deployment into an operating model the business can rely on.
That usually means:
- Refining the data model once users start asking better second-order questions
- Tightening permissions as more departments and managers need access
- Improving refresh schedules and report performance for heavily used dashboards
- Adding new subject areas carefully once the first dashboards are trusted
- Reviewing support ownership so report changes, data issues, and user requests do not sit in limbo
The sequence matters. Start with one area, prove that the numbers are trusted, then expand. That approach is usually more profitable for a mid-sized business than a broad BI launch that takes months to land and still leaves people arguing over definitions.
Managing Costs and Proving Return on Investment
A finance director in Nottingham or Lincoln will usually ask the same question after the first Power BI demo. What does this cost, and when do we see value?
That is the right question. Cloud BI should be judged as an operating model with measurable commercial impact, not as a technology purchase in isolation.
For a mid-sized business, Microsoft cloud BI costs usually sit in two places. Power BI licensing covers report creation, sharing, collaboration, and, where needed, premium capacity. Azure consumption covers storage, data movement, compute, and supporting services such as Data Factory, Azure SQL, or Synapse. That split matters because it gives you more control than a traditional on-premises BI estate, but only if someone owns the numbers.
How to keep spend under control
Cloud spend is easier to see. It is also easier to waste.
I have seen SMEs overspend in very ordinary ways. Refreshing datasets far more often than the business needs. Keeping old data nobody uses. Running larger Azure resources than the workload justifies. Paying for extra tooling before the first reporting use case has proved itself.
The practical fix is disciplined cost management from the start. In Microsoft environments, that usually means:
- Choosing the right Power BI licence level for current usage
- Sizing Azure services for the first use case, not the three-year ambition
- Setting refresh schedules around decision cycles
- Archiving or tiering older data instead of keeping everything in high-cost storage
- Reviewing report usage so abandoned dashboards do not keep consuming budget
- Assigning clear ownership for monthly cost review
That is FinOps in plain terms. Track spend, tie it to business use, and correct drift early.
For many East Midlands SMEs, this model is easier to justify than another server purchase. It turns BI into a staged investment. You start with one reporting problem, prove adoption, and expand on evidence rather than assumption.
On-Premises vs. Cloud BI Cost Comparison
| Cost Area | Traditional On-Premises BI | Microsoft Cloud BI (Azure + Power BI) |
|---|---|---|
| Infrastructure | Server purchase and refresh cycles | Usage-based cloud services |
| Maintenance | Internal patching, upgrades, hardware support | Platform services reduce admin overhead |
| Scalability | Expansion often requires new hardware | Capacity can be adjusted as needs change |
| Project start-up | Larger upfront investment | Lower upfront commitment |
| Reporting agility | Changes often need deeper technical effort | Faster iteration when models are designed well |
| Cost control | Fixed assets can hide inefficiency | Spend can be monitored through FinOps practices |
What a credible ROI case looks like
A good ROI case combines direct savings with operational improvement.
Direct savings are easier to measure. Less manual report preparation. Fewer spreadsheet reconciliations. Reduced dependence on ageing on-premises infrastructure. Fewer duplicated reporting tools across departments.
Operational gains often matter more, especially for distribution, manufacturing, and service firms across the East Midlands. Faster reporting can improve stock decisions, shorten month-end review, spot margin issues earlier, and give managers one trusted view of sales and operations. Those gains affect profit, even when they do not appear as a line-item saving in IT.
A simple ROI model usually works best:
- Hours saved each month in manual reporting
- Systems or licences retired
- Infrastructure spend avoided
- Revenue leakage or cost overruns identified earlier
- Management decisions made faster with fewer reporting disputes
This is also where governance supports the commercial case. If metrics are poorly defined, the business spends money on dashboards and still argues about the numbers. Clear ownership, access rules, and report standards help protect value over time. F1 Group covers that in its guidance on data governance best practices for Microsoft environments.
Keep the business case grounded
Market forecasts for cloud analytics are less useful to an SME than a practical payback model. Broader industry commentary, including DataEngineeringCompanies cloud security insights, can help frame the wider move to cloud data platforms, but the board conversation usually comes back to local realities.
For an East Midlands business, the question is usually straightforward. Can Azure and Power BI remove enough manual effort, improve enough decisions, and avoid enough legacy cost to pay for themselves within a sensible period?
In many cases, yes. The firms that see returns quickest are usually the ones that keep scope tight, choose a reporting problem with visible commercial impact, and review usage and spend every month.
Securing Your Data and Meeting UK Compliance
Security concerns are often the final barrier to cloud for business intelligence. They're valid concerns, but they're usually framed the wrong way. The fundamental question isn't whether cloud is safe in the abstract. It's whether your cloud BI environment is designed, governed, and managed properly.

What a secure Microsoft setup looks like
A sound Microsoft BI environment usually includes encrypted data storage, encrypted transit, role-based access, multi-factor authentication, and clear separation between development and production reporting. Identity matters as much as infrastructure. If access rules are weak, the reporting layer becomes a leak path.
Security also depends on governance discipline. Report sharing, data export rights, retention, and row-level access all need defined rules. In such cases, many organisations benefit from practical guidance on data governance best practices for Microsoft environments, especially once Power BI starts serving multiple departments.
UK compliance in practice
For UK organisations, data residency and UK GDPR obligations have to be considered early. That includes understanding where data is stored, who can access it, what leaves the platform, and how audit trails are maintained.
The cloud often improves this when compared with ageing on-premises estates, because policies can be applied more consistently and reviewed centrally. But that only happens if the solution is architected with compliance in mind from the start.
A useful companion read is DataEngineeringCompanies cloud security insights, which outlines common cloud data security challenges that BI projects need to account for during design.
A legacy server in a comms room isn't automatically safer than a cloud platform. In many cases, it's simply less visible and less well controlled.
Cloud BI is at its best when security, cost, architecture, and adoption are treated as one programme rather than separate workstreams. Get those aligned, and the platform becomes a dependable management tool rather than another reporting project that loses momentum after launch.
If your organisation wants a practical Microsoft-led approach to cloud BI, F1Group can help you plan the architecture, tighten security, and build reporting that people use. To discuss your options, Phone 0845 855 0000 today or Send us a message.